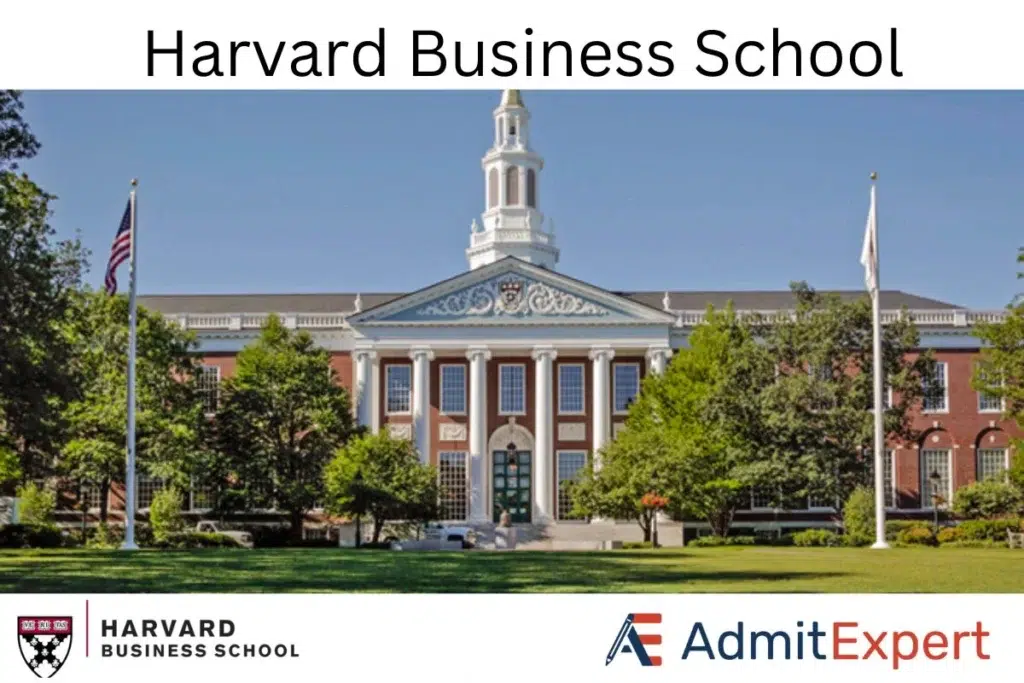
Harvard Business School (HBS), which is part of the Ivy League and M7, is consistently ranked as one of the best business schools in the world. The Harvard MBA program is known for bringing together some of the brightest young business minds.
Students in the Harvard MBA class of 2026 come from a wide variety of backgrounds and industries, including finance, consulting, technology, manufacturing, the non-profit sector, and the arts.
If getting into Harvard Business School is a goal of yours, our Harvard MBA Class Profile Analysis will provide insight into the kind of applicants who are successful in getting into the school. Additionally, we will also provide employment reports, cost of attendance, and scholarships at Harvard Business School.

General Information on Harvard Business School
Location – Soldiers Field, Boston, MA 02163
Dean – Srikant Datar
Admissions Office – MBA Admissions, Harvard Business School, Dillon House, Soldiers Field Boston, MA 02163
Phone: +1-617-495-6128
Email: admissions@hbs.edu
Social media – Facebook, Twitter, YouTube, Instagram, LinkedIn, Apple Podcasts, TikTok
Harvard MBA – By the numbers
Here are a few important statistics for the latest class i.e., the class of 2026 of the Harvard Business School
| Applications Received | 9856 |
| Class Size | 930 |
| Median GMAT Score | 740 |
| GMAT Range | 540-790 |
| Median GRE Score | 326 |
| GRE Range | 314-337 |
| Average GPA | 3.69 |
| Work Experience (Average) | 5 years |
| Tuition Cost for a Single Person (first year of the 2-year MBA) | $76,410 |
| Percentage of students that received a job offer | 95% |
| Median Base Salary | $175,000 |
| Median Signing Bonus | $30,000 |
| Median Performance Bonus | $47,500 |
Now, let’s take a look in detail at the latest incoming class i.e., the class of 2026 of Harvard Business School.
Harvard MBA Class of 2026: A Snapshot of Diversity and Excellence
Harvard Business School’s MBA Class of 2026 represents an impressive mix of talent, diversity, and leadership potential. This incoming cohort brings together individuals from a range of academic, professional, and cultural backgrounds, fostering a dynamic learning environment that is both inclusive and intellectually stimulating.
Harvard MBA Class of 2026 Overview
| Metric | Details |
|---|---|
| Total Enrollment | 930 |
| Applications Received | 9,856 |
| Women | 45% |
| International Students | 35% |
Geographic Representation
The class features students from across the globe, reflecting HBS’s commitment to global perspectives and cultural exchange.
| Region | Percentage |
| Africa | 2% |
| Asia | 13% |
| Canada | 3% |
| Europe | 8% |
| Mexico, Central & South America | 5% |
| Middle East | 3% |
| Oceania | <1% |
| United States | 65% |
Academic Background
The class is composed of students from a variety of academic disciplines, ensuring a broad spectrum of knowledge and problem-solving approaches.
| Metric | Details |
| First-Generation Students | 11% |
| Universities Represented | 296 |
| Average GPA | 3.69 (US 4.0 scale) |
Undergraduate Majors
| Field of Study | Percentage |
| Arts / Humanities | 5% |
| Business / Commerce | 24% |
| Economics | 19% |
| Engineering | 22% |
| Math / Physical Sciences | 18% |
| Social Sciences | 12% |
Professional Experience
With an average of five years of work experience, the Class of 2026 brings a wealth of professional knowledge, enhancing classroom discussions and case-based learning.
| Metric | Details |
| Average Work Experience | 5 Years |
Pre-MBA Industry Breakdown
| Industry | Percentage |
| Consulting | 18% |
| Consumer Products / Retail / E-Commerce | 9% |
| Financial Services | 10% |
| Health Care / Biotech | 8% |
| Manufacturing / Industrial / Energy | 9% |
| Media / Entertainment / Travel | 4% |
| Military | 5% |
| Nonprofit / Government / Education | 6% |
| Services | 2% |
| Technology | 12% |
| Venture Capital / Private Equity | 16% |
Standardized Test Scores
Harvard Business School welcomes applicants who submit either GMAT or GRE scores, demonstrating flexibility in admissions.
GRE Scores
| Category | Range |
| Verbal (All Scores) | 145–170 |
| Quantitative (All Scores) | 146–170 |
| Verbal (Middle 80%) | 157–168 |
| Quantitative (Middle 80%) | 157–169 |
| Verbal (Median) | 163 |
| Quantitative (Median) | 163 |
GMAT Scores
| Category | Range |
| Verbal (All Scores) | 27–51 |
| Quantitative (All Scores) | 35–51 |
| Total Score (All Scores) | 540–790 |
| Verbal (Middle 80%) | 38–47 |
| Quantitative (Middle 80%) | 45–50 |
| Total Score (Middle 80%) | 700–770 |
| Verbal (Median) | 42 |
| Quantitative (Median) | 49 |
| Total Score (Median) | 740 |
Note: 63% of admitted students submitted GMAT scores, while 41% submitted GRE scores. Some candidates provided both.
Key Insights from the Harvard MBA Class Profile
- Diversity in Representation: The Class of 2026 consists of 35% international students, contributing to a globally connected and cross-cultural learning experience.
- Gender Balance: With women making up 45% of the cohort, HBS continues to emphasize gender diversity in leadership development.
- First-Generation Students: 11% of students are first-generation college graduates, underscoring Harvard’s efforts to create opportunities for individuals from diverse socioeconomic backgrounds.
- Varied Academic Backgrounds: Students hail from 296 universities worldwide, with strong representation in engineering (22%), economics (19%), and social sciences (12%).
- Work Experience & Industry Spread: The average of five years of professional experience ensures that students bring mature perspectives to discussions. Consulting (18%), private equity (16%), and technology (12%) are among the leading industries represented.
- High Academic Standards: The class maintains a rigorous academic standard, with a median GMAT score of 740 and median GRE verbal and quantitative scores of 163 each.
Harvard MBA Application Deadlines
The application dates for the MBA Class of 2027 (incoming class of 2025) are
| Application Round | Deadline | Decisions |
| Round 1 | 04 SEP 2024 | 10 DEC 2024 |
| Round 2 | 06 JAN 2025 | 26 MAR 2025 |
The application deadline for 2024 HBS 2+2 applicants is:
| Application Round | Deadline | Decisions |
| 2+2 Round | 23 APR 2025 | 26 JUNE 2025 |
Now that you know the education and industry background of the latest class of Harvard Business School, you must have an idea of where you stand compared to them. To get into Harvard Business School try to match or exceed these numbers. Now, let’s take a look at the compensation that HBS MBA students get after they graduate.
Harvard MBA Employment and Placement Report: Class of 2024
Harvard Business School (HBS) continues to demonstrate its strength in career placement, equipping graduates with exceptional opportunities across industries and functions. The Class of 2024 employment data reflects HBS’s role in developing leaders who excel in diverse career paths, whether in traditional corporate roles, startups, or entrepreneurial ventures.
Employment Summary
| Metric | Percentage |
|---|---|
| Students Seeking Employment | 70% |
| Students Not Seeking Employment | 30% |
Breakdown of Students Not Seeking Employment
| Reason | Percentage |
| Starting Own Business | 14% |
| Company Sponsored or Already Employed | 13% |
| Other | 3% |
| Postponing Job Search | 1% |
| Continuing Education | 0% |
Salary Overview
| Metric | Amount | Receiving Percentage |
| Median Base Salary | $175,000 | 100% |
| Median Signing Bonus | $30,000 | 53% |
| Median Variable Bonus | $47,500 | 65% |
Employment by Industry
HBS graduates continue to secure high-paying roles across multiple industries, with finance and consulting remaining dominant career paths.
| Industry | Percentage | Median Base Salary | Median Signing Bonus | Median Variable Bonus |
| Consulting | 18% | $190,000 | $30,000 | $40,000 |
| Consumer Products | 3% | $150,000 | $40,000 | $30,000 |
| Entertainment / Media | 3% | $165,000 | $13,000 | $21,000 |
| Health Care | 6% | $165,000 | $30,000 | $29,000 |
| Investment Banking | 5% | $175,000 | $50,000 | $175,000 |
| Investment Management / Hedge Fund | 6% | $178,000 | $50,000 | $90,000 |
| Manufacturing | 5% | $165,000 | $30,000 | $40,000 |
| Nonprofit / Government | 5% | $120,000 | N/A | N/A |
| Private Equity | 19% | $180,000 | $31,000 | $155,000 |
| Retail | 2% | $142,000 | N/A | $25,000 |
| Services | 3% | $155,000 | N/A | $40,000 |
| Technology | 16% | $165,000 | $25,000 | $28,000 |
| Venture Capital | 5% | $178,000 | $15,000 | $42,000 |
Employment by Function
HBS graduates continue to thrive in finance and consulting roles, with strong representation in general management and marketing as well.
| Function | Percentage | Median Base Salary | Median Signing Bonus | Median Variable Bonus |
| Business Development | 8% | $165,000 | $28,000 | $30,000 |
| Consulting | 18% | $190,000 | $30,000 | $40,000 |
| Finance | 38% | $175,000 | $50,000 | $113,000 |
| General Management | 13% | $164,000 | $35,000 | $36,000 |
| Marketing | 11% | $155,000 | $30,000 | $26,000 |
| Strategic Planning | 8% | $145,000 | $25,000 | $27,000 |
| Other | 5% | $150,000 | $25,000 | $42,000 |
Employment by Location
| Region | Percentage | Median Base Salary | Median Signing Bonus | Median Variable Bonus |
| United States (88%) | ||||
| Mid-Atlantic | 5% | $172,000 | $30,000 | $33,000 |
| Midwest | 6% | $175,000 | $30,000 | $44,000 |
| Northeast | 49% | $175,000 | $30,000 | $48,000 |
| South | 5% | $175,000 | $30,000 | $48,000 |
| Southwest | 6% | $175,000 | $30,000 | $61,000 |
| West | 17% | $180,000 | $30,000 | $40,000 |
| International (12%) | ||||
| Asia | 5% | $120,000 | $25,000 | $50,000 |
| Europe | 5% | $135,000 | $25,000 | $50,000 |
| Latin America | 1% | $115,000 | N/A | N/A |
Startups and Entrepreneurship
HBS has a strong focus on fostering entrepreneurship, with a significant portion of graduates pursuing startup ventures.
| Metric | Details |
| Students Joining Startups | 12% |
| Median Base Salary at Startups | $160,000 |
| Percentage of Founding Businesses | 14% |
Industries of Founding Businesses
| Industry | Percentage |
| Technology | 55% |
| Health Care | 17% |
| Manufacturing | 8% |
| Marketing | 25% |
Key Takeaways from the Employment Report
- High Employment Rate: Of the 70% of students seeking employment, 85% received offers, and 77% accepted them, reflecting a strong job market but slightly lower figures than previous years.
- Diverse Career Paths: 30% of students did not seek traditional employment, with 14% launching their own businesses and 13% remaining in roles with prior employers.
- Competitive Compensation: The median base salary of $175,000 is complemented by generous signing bonuses ($30,000) and variable bonuses ($47,500), demonstrating the value of HBS graduates.
- Finance and Consulting Lead: Consulting (18%) and finance (38%) continue to dominate, offering high salaries, particularly in private equity and investment banking.
- Tech and Startups on the Rise: Technology placements (16%) and startup involvement (12%) highlight the growing interest in innovation-driven careers.
- Regional Trends: The Northeast (49%) leads in domestic placements, while the West (17%) remains popular due to its vibrant tech ecosystem.
- Entrepreneurial Drive: With 14% of students founding businesses, HBS’s support for entrepreneurship remains a key differentiator.
Harvard MBA Cost of Attendance and Scholarships
Harvard Business School (HBS) recognizes its MBA program as a long-term investment in leadership and career success. The total cost of attendance includes tuition, fees, and living expenses, while a comprehensive financial aid system ensures accessibility through scholarships, fellowships, external funding, and loan options. Below is a breakdown of the estimated costs and available financial support.
Cost of Attendance for the 2024–2025 Academic Year
The cost structure is designed for a nine-month academic year and varies for single students, married students, and those with dependents.
Estimated Costs for Single Students
| Expense | Amount |
|---|---|
| Tuition | $76,410 |
| HUHS Student Health Fee | $1,592 |
| Student Health Insurance Plan | $4,202 |
| Course & Program Materials Fee | $2,650 |
| Housing | $17,280 |
| Food | $6,120 |
| Transportation | $2,280 |
| Other Living Expenses | $8,320 |
| Total | $118,854 |
Cost Adjustments for Different Family Structures
| Family Structure | Total Cost |
| Married | $143,636 |
| Married with One Child | $160,918 |
| Married with Two Children | $166,142 |
Financial Aid and Scholarships
HBS provides need-based financial assistance, ensuring that the MBA remains accessible to students from various economic backgrounds.
| Metric | Amount |
| Average Need-Based Scholarship | $92,000 over two years |
| Total Scholarship Funds Awarded (FY23) | $51 million |
| Median Starting Salary Post-HBS | $175,000 |
| Median Signing Bonus Post-HBS | $30,000 |
Scholarships at HBS
Approximately 50% of students receive need-based scholarships, which do not require repayment. Scholarship opportunities include:
- Need-Based Scholarships: Cover a portion of tuition and fees based on financial circumstances.
- Full-Tuition Scholarships: Awarded to students with the most significant financial need.
- Middle-Income Scholarships: Expanded in 2022 to support students from middle-income backgrounds.
Assessing Financial Need
HBS determines financial need based on:
- Gross income over the past three years.
- Personal assets and socioeconomic background.
- Undergraduate loan obligations.
- Spouse’s income and assets (if applicable).
A standardized evaluation ensures fairness, with financial aid distributed accordingly.
Financial Aid Package Components
HBS financial aid packages typically consist of:
- Need-Based Scholarships: Covering part of tuition and fees.
- Student Loans: With flexible repayment terms to manage remaining costs.
- Complementary Fellowships: Additional funding based on specific eligibility criteria.
Funding the MBA Program
Students finance their MBA through various means, including:
- Personal Savings: Self-funding from accumulated savings.
- Employer Sponsorships: Some companies provide financial support.
- External Scholarships: Offered by organizations outside HBS.
- Student Loans: Available with repayment options.
Distribution of Costs for Single Students
The annual total of $118,854 is primarily allocated as follows:
- Tuition: $76,410 (largest component)
- Indirect Expenses: $34,000 (housing, food, transportation, and personal expenses)
- Mandatory Fees: $8,444
Final Thoughts
Getting an MBA from Harvard Business School is a dream for most MBA applicants. Harvard Business School is one of the best business schools in the world, so getting into it can be hard. Even though there is no foolproof method to ensure admission to HBS, you can improve your chances significantly by working diligently on your application. We can help you get into Harvard Business School. Our consultants include HBS alumni who will give you the most accurate advice and guidance you’ll need to get into HBS. So, get started now.


